beautiful data science
Machine Learning: The Rudiments, Visualized
by Elijah Sippel and Sam Watson

For most, the words "artificial intelligence" and evoke images of the Terminator and robot armies taking over the world. While we haven't reached that point (yet), machine learning, a subset of modern AI, has become ubiquitous in the tech industry and data science field.
Pop culture and media tend to depict machine learning (generally abbreviated as ML) as a mystical branch of computer science that only the most talented programmers and mathematicians are capable of comprehending. While that may have been true decades ago, the barrier to entry in 2021 has fallen dramatically.
Why we think ML is hard
The real barrier for understanding ML concepts is not the actual complexity of the ideas, but that they are typically communicated through math notation and code. For those who aren't familiar with those modes of expression, the ideas can still be made readily accessible if expressed in other ways. By the end of this interactive article, you too will be well on your way to a rudimentary understanding of the mathematical basis for modern ML algorithms.
Machine Learning
Let's begin by taking a look at this mathlet (interactive graphic). Just about everything you see here is manipulative— try dragging one of the white points around and see what happens!
Notice how the orange area changes as you move the points; try to adjust the line by dragging the white points around and try to minimize the total orange area! What's the lowest value you can get?
The best we can do is roughly 1.373, so if you managed to get there, great job!
Incidentally, one way to get there without having to rely on luck is to adjust one handle at a time: we move one of the two ends up and down to get the orange area as low as possible. Then we drag the other dot to get the area even lower. Then back to the first dot, and so on, back and forth. Pretty soon we'll get it to a point where the orange area isn't decreasing anymore, and then we can declare victory!
Let's try it again, this time on a 3D plane instead of 2D. You can drag on the window to change your view, and drag the sliders on the left side to transform the gray plane, and see how small you can get the orange area!
❌ Something went wrong.
Just like that, you've already learned your first machine learning idea! By dragging the line into place one end at a time, you've carried out an optimization algorithm called coordinate descent. Making adjustments to try to minimize some undesirable quantity (like the orange area in the mathlet) is a major theme in machine learning. You're well on your way at this point, even though we still need to talk about what machine learning is.
Image Data
Suppose you want a computer to accomplish a complex task, such as recognizing a pedestrian in a self-driving car's camera feed.
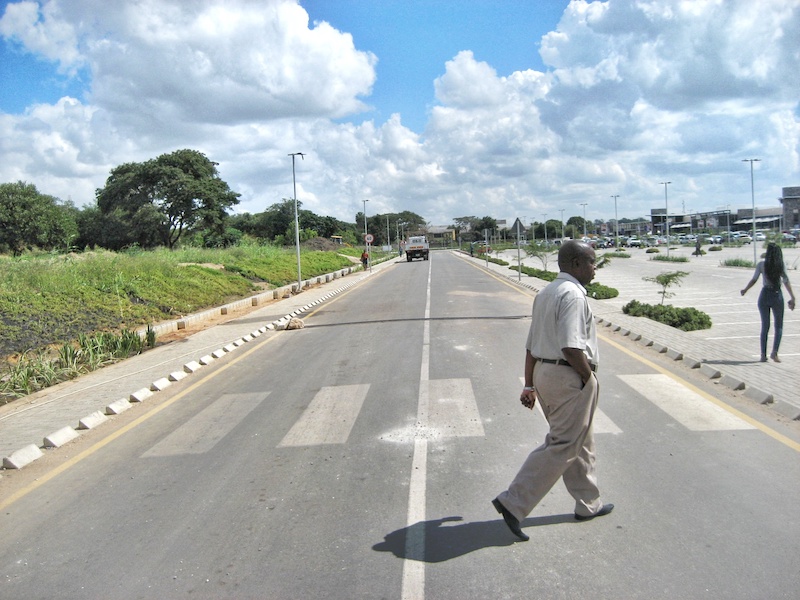
Pedestrian near a crosswalk
Which most accurately describes how a computer would "perceive" this image?
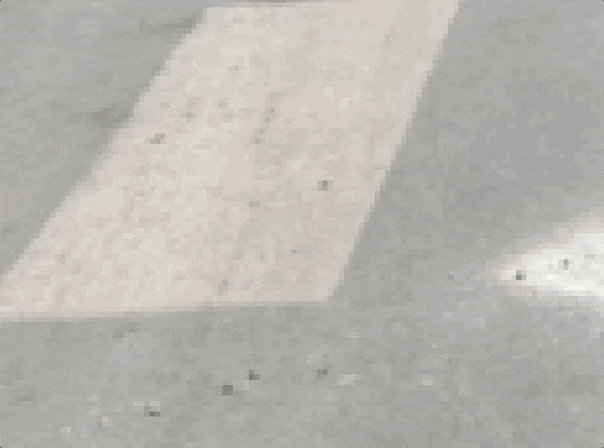
Look at those pixels
You probably don't notice it when the photo is zoomed out, but let's take a closer look at the little squares that comprise the image. We'll zoom in on the corner of the crosswalk stripe.
Internally, each little square (or pixel) is stored as a number (specifically, a number between 0 and 16777215) and the computer knows how present that number as a color on your monitor.
This particular image is 800 pixels wide by 600 pixels tall, for a total of 480,000 pixels.
Making Predictions
So in order to determine whether there's a pedestrian in the crosswalk, we'll need to somehow process all 480,000 numbers to generate a useful output. In this case, it would be useful to produce a number: either a 0 (to indicate no pedestrian) or a 1 (for one or more pedestrians).
There are endless ways to manipulate the grid of numbers that represents the image in order to get out that 0 or 1, but let's try this: look at a single, specific pixel somewhere in the image, and if its value is bigger than, say, 8388608, give an output of 1. If it's smaller, give an output of 0.
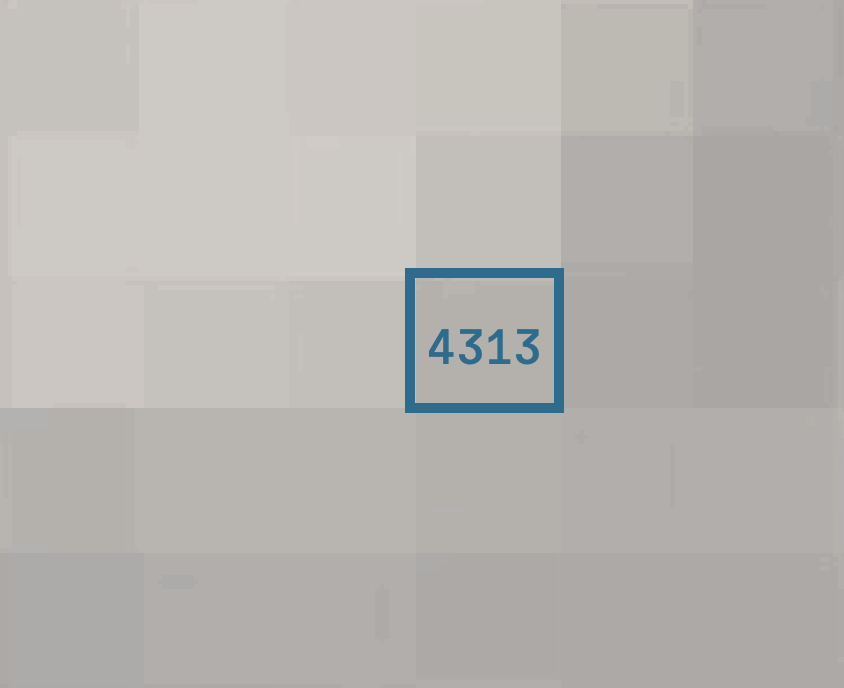
This is the pixel in question!
Suppose the pixel we are checking is the one here, highlighted in blue, and that its numerical value is 4313. Based on the rule we defined, we would return a...
Great! Now I'm wondering, what do you think about this rule? Is it practical for the task we're trying to accomplish?
Even though this rule seems entirely useless, it's actually an excellent starting point. We're going to modify it, one step at a time, to work our way towards actual state-of-the-art methods used for this kind of problem.
Here's the key idea: one pixel isn't very useful on its own, but what about two pixels? Instead of a single number, we'll now have a pair of numbers. And a pair of numbers can be naturally represented as a point on a...
Here's a single point on a number line:

And here is a pair of numbers on a plane. We call the values 2 and 3 the coordinates of the point (2, 3).

Because this geometric connection between pixel colors and points in the plane is so important to the story, let's make it really tangible. You can control the colors of the two pixels in this mathlet by dragging the point around in the square on the right.
For convenience, we're showing plotting the pixel-representing numbers on a scale from 0 to 1, rather than from 0 to 16777215.
Notice that if we move the point in a direction parallel to one of the axes, we can keep one color constant. For example, if we move the point vertically, its first coordinate stays the same, while the second coordinate changes, changing the color of the pixel on the right.
Notice also that the points along the diagonal (the line that connects (0, 0) and (1, 1)) have the property that the two pixel colors are the same.
Now, the cool thing about looking at two pixels instead of one is that it gives us a lot more information to work with to try to separate out pedestrian-containing images from non-pedestrian-containing images. Let's see how we do that!
Learning from Data
Suppose you collect four images with pedestrians and four images without pedestrians. You look at two specific pixel color values and plot them in a square on a plane (per the scheme above), coloring them teal (pedestrian) and orange (no pedestrian) so you can tell them apart.
These eight points (which, remember, come from a pair of pixels from each of the images) are called training data. We're going to use them to try to figure out what to do to tell whether a given image has a pedestrian in it.
This brings us to a key conceptual point about how machine learning is different from other kinds of computational tasks: in machine learning, the system looks at real data to figure out what to do.
In other words, we're acknowledging up front that we aren't going to be able to work out from scratch what the computer needs to do with those 480,000 numbers to give us a correct 0 or 1 response. Instead, we'll hand the computer lots of images and see if it can find patterns in the data that it can use to reliably discern which images have pedestrians in them.
Separating Lines
Alright, now back to our 8 training points. When you first saw those points, your visual cortex probably couldn't resist mentally separating the two groups using a line. Drag the two points on the dark blue line such that all of the teal points are on one side and all of the orange-colored points are on the other side.
As you may have noticed, there are many lines that would separate the points correctly based on these criteria; we might as well pick a good one! Consider this question: what would be a good way of determining which separating line is "better" than the others?
Here's an idea: let's thicken the line into a slab, and look for the thickest slab that still separates the points. This should be a bit more accurate for points closer to the line!
💡 Helpful Tip: In this mathlet, drag the arrow around to shift the whole slab, and drag the points to make it thicker, thinner, or to rotate the slab.
The thing we just did—finding the thickest slab which separates two classes of points—is actually one of the most commonly used machine learning models! It's called a support vector machine.
You might guess that this particular support vector machine, which looks at only two pixels, isn't very useful if we have 480,000 pixels in our whole image that are available to make predictions. You'd be right.
But that's because it's only looking at two pixels. If we look at three pixel values, we'd get points in three-dimensional space, and those points could be separated with— you guessed it— a three-dimensional plane!
Support Vector Machines in Higher Dimensions
Here's an example of a plane in three-dimensional space that separates four teal points from our orange-colored points (you can drag to rotate it around and see what's going on):
❌ Something went wrong.
It's going to be important to think for a minute about what this looks like in equation form. Let's consider the 2D plane first. Suppose the equation for our separating line happens to be something like:
This means that a point is on the line if twice its first coordinate plus three times its second coordinate is equal to 6.
Then we can tell which side of this line a particular point (x, y) is on by checking...
So, mathematically, the search for a separating line is equivalent to a search for an expression like $2x+3y$2x+3y which happens to be larger than a certain value (6, say) for all teal points and smaller that value for all tomato-colored points.
Likewise, the equation for a separating plane in three dimensions might be something that looks like:
in which case the $2x+3y+6z$2x+3y+6z value for each teal point would be greater than 12 and for each tomato point would be less than 12.
Looking at things this way is important because...
Moving from three dimensions to four (that is, considering four pixels instead of three), we can say that we're looking for an equation like:
where the left-hand side is smaller for each point $(w,\ x,\ y,\ z)$(w, x, y, z) that corresponds to a pedestrian-containing image, and where the left-hand side is greater for the rest of the images.
Of course, for the practical problem, four pixels is not really all that much better than 1. But the key thing now is that we're no long limited in how many pixels we can consider.
What we're really looking for is 480,000 numbers that we can multiply in pairs with the actual 480,000 pixel values and add up, yielding larger values for pedestrian-containing images and smaller values for the others.
Numerical Optimization
While this might seem like a tall order, it turns out that this is something that computers are great at. There are general-purpose software packages that you can feed this problem into and get an answer back remarkably efficiently.
Roughly speaking, the way this works is that the computer starts with 480,000 random values (playing the role of the four numbers $[-1,\ 3,-2,\ 4.5]$[−1, 3,−2, 4.5] in the expression $-w+3x-2y+4.5z$−w+3x−2y+4.5z), and it checks how well those values manage to separate the training data. It will almost certainly be terrible.
But then the computer will propose small nudges each of those values it started with. It can say for each little nudge whether it would separate points slightly better than before, or slightly worse. Then it moves all 480,000 values in whichever direction made things a little better.
It can apply this process repeatedly to achieve slightly better separation on each step. Eventually, we'll arrive at values which separate the training data about as well as possible.
While support vector machines work a lot better than nothing on image recognition tasks like identifying pedestrians, they're not good enough for real self-driving vehicle technology.
To think about why this is the case, imagine a slightly different dataset.
These points...
We should be able to separate these points, just not with a line. We would want to use a curve instead, perhaps one which encircles the teal points in the middle.
It shouldn't be surprising that this kind of situation comes up in practice a lot, because there's nothing all that special about lines and planes. It could very well happen that the data from each class (pedestrian/non-pedestrian) tend to show up in particular regions in the space of images, but that those regions happen to be entangled from the point of a view of a separating line/plane.
If we're going to overcome the "flatness" limitation of lines and planes, we'll need the ability to morph or fold space somehow.
Try dragging the gray line before revealing a solution!
For example, perhaps the simplest way to fold space is to choose a line and reflect every point which is below it. Try dragging the gray line in such a way that the classes of points would be readily separable by a second line (the dark blue one).
Being able to use these two lines in tandem gives us a lot more flexibility.
The mathematical term for the idea we're leveraging here is composition. In other words, we take two actions in sequence: first we reflect all the points based on the location of the gray line, and then we figure out which side of the blue line each resulting point is on.
We call these sequential actions layers. For example, we'd say that the reflection in the mathlet above is the first layer, and the separating line is the second layer.
Furthermore, there's no reason to stop at two layers! We could, for example, fold across one line, then fold across a second line, and then separate the points with a third line.
This generalization of the support vector machine, which allows a sequence of space-morphing actions prior to separating the points, is called a neural network.
Sticky Axes: ReLU Layers
One popular space-morphing action is to make the coordinate axes sticky. This might seem strange, but actually it tends to work quite well.
Consider the following problem, where we're trying to classify every point inside the semicircle as yellow, and every point outside as purple.
To accomplish this feat, we're allowed to linearly transform the points however we want (rotate/scale/translate/etc).
You can move the green and blue vectors to control this transformation. Then any points which happened to cross a coordinate axis get snapped back to it. Lastly, we try to separate the points using the line (which you can rotate using the tomtato handle or translate by grabbing it anywhere else).
See if you can get most of the points classified correctly.
This kind of layer (one that uses linear transormation of the data), is known in the business as a dense layer with ReLU activation (pronounced RAY-loo). A typical neural network used in research or industry works on exactly the same principles as the example we just experimented with.
The key differences are:
- The number of layers. Normally, there are many more than two.
- The number of dimensions in the spaces being transformed along the way. Again, typically many more than two.
- Reduced flexibility in what the transformations can do.
Here's an example where our data points are in 3D space. We'll use a neural network with several dense layers with ReLU activation. Some of the layers use more than three dimensions, so isn't possible to visualize each transformation as we did above. But we can still take a look at the surface the model uses to predict: teal on one side, tomato on the other.
Adjust the slider to observe how the decision surface "shrink wraps" around the tomato points as the model trains (the values on the slider indicate the number of transformations that have been taken place).
At the end, are there still some points on the wrong side of the surface?
The decision surface has sharp creases, just like the decision boundary in the two-dimensional case has sharp edges. Nevertheless, the model has enough flexibility to use its flat facets to mold to the data and separate out the points quite nicely.
This picture perfectly encapsulates one aspect of what makes neural networks so powerful: in many real data problems, the points from the two classes are somewhat entangled, but not hopelessly so. Neural networks have the flexibility to produce decision surfaces of pretty much any shape, and the training process often does allow suitable shapes to form.
Closing
Just like that, you've experienced the basis for the bleeding-edge of machine learning technology. Hopefully you found this introduction helpful!
If you're hungry for more, I highly recommend the excellent video series on neural networks by 3Blue1Brown. He goes through the key introductory ideas in vivid detail.
If you're curious, the code for this website is hosted on GitHub, at the link below. There, you'll also find more information about how it was made and how you can use these components in your own web app!
Feel free to also reach out by email with any other questions.